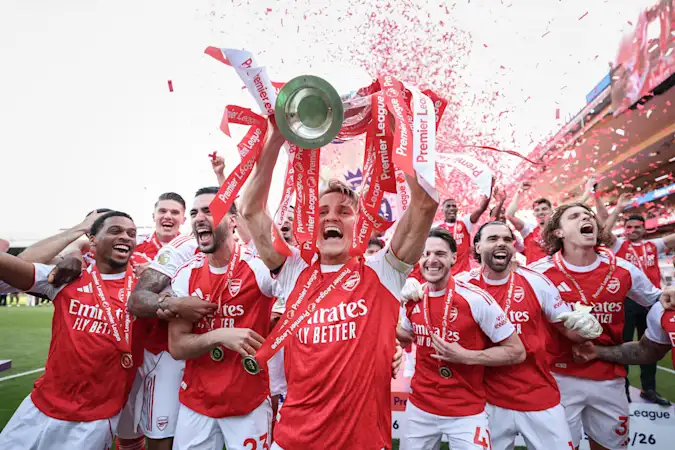
Although Arsenal may have finally got their hands back on the Premier League title, there has been a wider narrative surrounding this season. The collective product on offer has felt too tight, too controlled and largely underwhelming.
A largely boring campaign has been the term uttered by many and although this could be an example of non-Arsenal bias, the overall perception is that this season has not necessarily been one for the ages.
But is that perception a fair one? Because when you step back from individual moments and look at the long-term data, the picture becomes a lot more complicated. The reason for this is that the average number of Premier League goals per game has rarely moved in a straight line.
Due to tactical cycles and managerial trends, these structural shifts will create an environment of ebb and flow when it comes to the number of goals scored in a single season. This, in turn creates a state of flux when it comes to tracking the overall output across the division.
Which means it is time to crunch the numbers in a bid to see just how much entertainment has been offer across the course of the past nine months. Has this Premier League campaign been worth your attention?
What follows is the full breakdown of goals per game since the beginning of the Premier League era as we see how the class of the 2025/26 season stack up against their previous contemporaries.
Season | Goals | Matches | Goals Per Game | Notes |
1991/1992 | 1174 | 462 | 2.54 | Pre-Premier League |
1992/1993 | 1222 | 462 | 2.65 | Passback Rule |
1993/1994 | 1195 | 462 | 2.59 | |
1994/1995 | 1195 | 462 | 2.59 | |
1995/1996 | 988 | 380 | 2.60 | |
1996/1997 | 970 | 380 | 2.55 | |
1997/1998 | 1019 | 380 | 2.68 | |
1998/1999 | 959 | 380 | 2.52 | |
1999/2000 | 1060 | 380 | 2.79 | |
2000/2001 | 992 | 380 | 2.61 | |
2001/2002 | 1001 | 380 | 2.63 | |
2002/2003 | 1000 | 380 | 2.63 | |
2003/2004 | 1012 | 380 | 2.66 | |
2004/2005 | 975 | 380 | 2.57 | |
2005/2006 | 944 | 380 | 2.48 | |
2006/2007 | 931 | 380 | 2.45 | |
2007/2008 | 1002 | 380 | 2.64 | |
2008/2009 | 942 | 380 | 2.48 | |
2009/2010 | 1053 | 380 | 2.77 | |
2010/2011 | 1063 | 380 | 2.80 | |
2011/2012 | 1066 | 380 | 2.81 | |
2012/2013 | 1063 | 380 | 2.80 | |
2013/2014 | 1052 | 380 | 2.77 | |
2014/2015 | 975 | 380 | 2.57 | |
2015/2016 | 1026 | 380 | 2.70 | |
2016/2017 | 1064 | 380 | 2.80 | |
2017/2018 | 1018 | 380 | 2.68 | |
2018/2019 | 1072 | 380 | 2.82 | VAR |
2019/2020 | 1034 | 380 | 2.72 | |
2020/2021 | 1024 | 380 | 2.69 | |
2021/2022 | 1071 | 380 | 2.82 | |
2022/2023 | 1084 | 380 | 2.85 | |
2023/2024 | 1246 | 380 | 3.28 | |
2024/2025 | 1115 | 380 | 2.93 | |
2025/2026 | 1045 | 380 | 2.75 |
If we look at the output of the 2025/26 season we can see that 2.75 goals per game were scored on average. That’s a total of 380 games and 1,045 breaches of the opposition defences. A figure that does not sound too bad in isolation, but there is no isolation to be found here.
Even if we compare the current edition of the Premier League to the previous one, we can see that there were 0.18 fewer goals scored on average per game. The value of goals per game dropping from 2.93 to 2.75.
That in itself, is hardly a reason to call the Premier League boring but when you map that 2.75 against a record-breaking campaign of 2023/24, you can begin to see where the perception may start to become closer to reality.
The 2023/24 season collected a total of 1,246 goals across all 380 games – an average of 3.28 per season. A barnstorming campaign for attacking players and one to forget when it came to their defensive counterparts. A GOAL BONANZA
Interestingly, the class of 2023/24 was the only time in which the average goals per game figure crept over three. Then again, it didn’t just creep over that value, it almost exploded past it. The perfect combination between goal poachers and weak teams towards the bottom of the table.
If you take that record season’s value of 3.28 and compare it to the one that has just been etched into the history books, you will see that we are 0.53 goals off of the peak. Undoubtedly a drop off, but not the cataclysmic picture that some would have been painting.
Especially when you look at the VAR era as it’s own analysis and if we take these eight seasons and rank them in terms of average goals per game order rather than in a chronological format, it opens up another layer of insight:
Season | Goals | Matches | Goals Per Game | Notes |
2023/2024 | 1246 | 380 | 3.28 | |
2024/2025 | 1115 | 380 | 2.93 | |
2022/2023 | 1084 | 380 | 2.85 | |
2018/2019 | 1072 | 380 | 2.82 | VAR |
2021/2022 | 1071 | 380 | 2.82 | |
2025/2026 | 1045 | 380 | 2.75 | |
2019/2020 | 1034 | 380 | 2.72 | |
2020/2021 | 1024 | 380 | 2.69 |
TAKE ANOTHER LOOK This ‘boring’ season actually sits sixth out of the eight in the table, the two seasons that sit below are what you would mark as the ‘Covid campaigns’. A correlation between a lack of audience to play in front of or maybe just nothing more than coincidence.
In addition to this, if you took an average of these eight seasons, the goals per game figure would come to 2.86. Compare that to the 2025/26 figure of 2.75 and this season is only 0.11 goals below average.
Had the bonanza of 2023/24 not been so profitable in terms of goals scored, the picture would be far less diluted than it is now. Which begs the question; was this season boring or is it just being compared to recency bias?
Especially when you look at the pattern of goals scored between the 2022/23 and 2024/25 seasons. These three seasons in isolation have created the three highest average goals per game figures in Premier League history.
The latter two of these three seasons saw then promoted sides sent straight back down. A large underlying reason for this was due to how bad their collective defences were and therefore, this leads to an increase in overall goals being scored.
Compare that to this season when the relegation picture was far less clear than in previous years and it felt like one of the toughest divisions from top to bottom in many years – arguably even the toughest of all-time.
So how does the recency bias get removed? The best way to answer that is by seeing how the 2025/26 season stacks up against historic low-scoring seasons and seeing what patterns then emerge.
Season | Goals | Matches | Goals Per Game | Notes |
2006/2007 | 931 | 380 | 2.45 | |
2008/2009 | 942 | 380 | 2.48 | |
2005/2006 | 944 | 380 | 2.48 | |
1998/1999 | 959 | 380 | 2.52 | |
1996/1997 | 970 | 380 | 2.55 | |
2004/2005 | 975 | 380 | 2.57 | |
2014/2015 | 975 | 380 | 2.57 | |
1993/1994 | 1195 | 462 | 2.59 | |
1994/1995 | 1195 | 462 | 2.59 | |
1995/1996 | 988 | 380 | 2.60 | |
2000/2001 | 992 | 380 | 2.61 | |
2002/2003 | 1000 | 380 | 2.63 | |
2001/2002 | 1001 | 380 | 2.63 | |
2007/2008 | 1002 | 380 | 2.64 | |
1992/1993 | 1222 | 462 | 2.65 | Passback Rule |
2003/2004 | 1012 | 380 | 2.66 | |
2017/2018 | 1018 | 380 | 2.68 | |
1997/1998 | 1019 | 380 | 2.68 | |
2020/2021 | 1024 | 380 | 2.69 | |
2015/2016 | 1026 | 380 | 2.70 | |
2019/2020 | 1034 | 380 | 2.72 | |
2025/2026 | 1045 | 380 | 2.75 |
COULD BE WORSE Of the 34 complete Premier League seasons, the ‘boring’ season of 2025/26 sits 22nd in terms of lowest goals scored. There are only 12 seasons that have recorded a higher average goals per game since the competition began in 1992.
Compare the 2.75 average goals per game this season to the nadir of the 2006/2007 campaign and it will seem like Mikel Arteta’s Arsenal and their cohorts across the division will have been nothing less than box office entertainment.
Wind back 19 years and the average goals per game came in at an all-time low of 2.45 goals per game. 0.30 less than what we saw this season – not even a figure high enough to interest those who like to bet on over 2.5 goals each weekend.
Ultimately, what this data suggests is not a league in decline but a league being judged against a distorted reference point. The recent spike in 2023/24 has recalibrated expectations in a way that makes everything that follows feel subdued by comparison.
Strip that out and the picture looks far more familiar: a competition that continues to oscillate within a long-standing scoring band rather than one moving in a clear downward direction. On that basis, the current level of output still sits comfortably within a historically healthy range for goals.
Whether this season felt boring is therefore less a question of raw output and more a question of contrast and expectation. The numbers do not show a collapse in entertainment; they actually show a return to equilibrium after an exceptional peak.