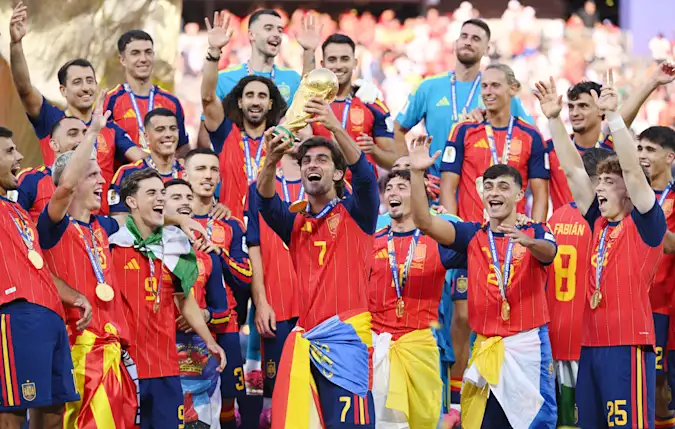
104 games contested, the 2026 edition of the FIFA World Cup is now in the history books. Spain winning their second title after previously doing so 16 years ago, their win over Argentina halting the South American outfit from earning back-to-back outright victories.
Admittedly, the spectacle of the final did not live up to expectations, as Argentina aimed to scratch and claw their way to a repeat of their victory in Qatar four years ago but thankfully football was at least the winner after Ferran Torres’ goal in the second half of extra-time.
The Barcelona forward scored one of more than 300 goals in this summer’s tournament in North America. It was certainly the biggest edition of the World Cup to ever be staged, but was it the best? A look at the numbers behind those 104 games may go some way to answering the question.
Goals Per Game
More games equal more goals. That was the hypothesis before this year’s World Cup got underway and with 40 more games compared to Qatar 2022, it is no surprise that there was an increase of 136 goals when comparing this tournament to the previous edition.
172 in the Middle East four years ago, that figure swelling to 308 by the time Ferran Torres had slotted home the final entry on this summer’s scoresheet. An increase in goals stands to reason when there are so many more games, but how does it measure from a goal average perspective?
An average of 2.69 goals per game in Qatar, a figure that increased to 2.96 at the end of the 2026 tournament. A figure that was undoubtedly boosted by the 10-goal thriller that took place in the Bronze play-off between England and France on Saturday.
With that being said, even if you took that game out of the equation, the goals-per-game average would still sit higher than in 2022 and therefore, if you are a fan of goals (who isn’t?), then you would have been well catered for in North America.
Both Teams To Score %
Another measure that would have been of interest is the number of games that finish with both teams getting on the scoresheet. A flurry of goals is always positive, even more so when there is something of an equitable shift attached to them.
Of the 104 games that have taken place in North America this summer. 57 of them finished with both sides getting on the scoresheet. That equates to 54.81% or more than one in two fixtures contested at this year’s World Cup.
Those 57 games in which at least one goal was scored by each team saw a breakdown of 39 games across the group stage and 18 in the knockout phase. This also meant that of the 32 knockout games, 56.25% ended with both teams scoring at least once.
Over 2.5 Goals %
Staying on the topic of goals, but this time looking at things from an over 2.5 perspective, this is the figure that is arguably the most interesting when it comes to placing bets on the outcomes of World Cup matches.
Of the 104 games played, as many as 58 logged three or more total entries on the scoresheet and this equated to 55.77% of all the fixtures in the tournament. When drilling down into the 58 matches in the sample, 18 of them were in the knockout phase.
This means that when looking solely at the knockout phase matches, 56.25% of them finished over 2.5 goals. This is the same percentage as both teams to score in the knockout phase but it is not a direct copy in terms of the 18 matches ticking off both criteria.
Team Wins When Scoring First %
Perhaps the most interesting statistic is monitoring how many teams managed to win after breaking the deadlock. The same 104 game sample highlighted that 65 games saw a team go in front and subsequently go on to win the game.
That figure equates to 62.50% or five in every eight tournament games but the figure is arguably more impressive when you strip draws out of the equation. Once 24 stalemates have been wiped from the analysis, it leaves us with 80 games producing a winning side.
That winner can be in regulation or extra time and penalties, but ultimately, 65 games have seen a team go ahead and stay ahead at the final whistle. When looking at it from a percentage perspective, this equates to 81.25%.
Just over eight of every ten games that produced a winning side saw the opening scorer benefit at full time. Further highlighting the importance of getting your nose in front and then keeping it clean for the rest of the encounter.
Clean Sheet %
When we look at all these attacking numbers on show, it does little to put the defence in a good light and with the world’s best players taking centre stage in North America, the expectation for clean sheets would be rather low.
Something that is reinforced by the percentage return across the tournament. 104 games, 208 non-unique nations taking to the field throughout and with only 55 clean sheets recorded from the opening games to the last, this is just over one out of every four potential opportunities.
Ironically, there were clean sheets in both the opening and closing games of the tournament, but it is fair to say that Spain’s shutout of Argentina was far more important than what Mexico managed to achieve in the competition’s curtain-raiser.
Of the 208 opportunities, those 55 recorded equated to 26.44% across the tournament. In a sense, it seemed as if an attack was the best way to defend.
Average cards per game
Now a look at discipline and this is where Argentina supporters may want to look away. Their national football team may have fallen short in the final but they did at least pick up the accolade of finishing first when it comes to recording unfair play.
A total of 281 cards were shown across 104 tournament games – an average of 2.70 per game, Argentina collected 14 of them for themselves or for every 20 cards shown by a referee, one of them would have gone to Lionel Scaloni’s side.
In fairness to Argentina, playing the maximum number of games would also give them more chances to pick up yellow cards and therefore, an average number of cards per game should also be taken into consideration when looking at the list of football crimes.
When taking this into account, it is actually Egypt who walked the biggest disciplinary tightrope of the tournament. The Pharaohs collected 12 yellow cards across their five tournament outings, at an average of 2.40 per game.
On the flipside the tournament’s prefects were both Tunisia and the Czech Republic as they only collected one booking each across their respective three group stage games. Working out at an average of 0.33 cards per game.
One-goal winning margin
While the margin of victory is not something that should be overlooked either. Comfortable victories are the preference; narrow ones are just as important and especially when 35 of the 104 games were settled by a winning margin of a single goal.
This equates to 33.65% or just over one game out of every three ending in a win by the barest of margins but this figure gets more impressive when you strip out the 24 tournament draws that were recorded.
This means that of the 80 games that were won, 35 or 43.75% were by the single goal. Just under one of every two winning outcomes at this summer’s World Cup were thanks to a single goal win, by comparison, 23 of the 80 were by a two-goal margin (28.75%).
The knockout stages produced the ultimate example of fine margins: 17 of 32 matches were decided by one goal, yet none required penalties. Teams were consistently close, but every knockout tie found a winner through open play or extra-time, highlighting the fine margins at play when it truly mattered the most.