Premier League Stats: How the Expected Goals Differential table looks after Gameweek 10
 Will Evans


The Premier League table is finally starting to take shape, as we head into the second international break of the season.
Ten matches have now been played in England’s top-flight this term, providing a healthy sample size from which to assess each club’s relative merits.
Points on the board are not necessarily the only indicator of a side’s quality, however, even at this stage of the campaign.
Underlying metrics can help us gain a clearer picture of who is outperforming the data – and which teams could have more in the tank over the months ahead.
We’ve already taken a look at the division’s xG (expected goals) leaders and top xGA (expected goals against) records in recent weeks.
And this pause in the domestic schedule allows us to go one step further, by comparing the Premier League xG and xGA tables to create a combined Expected Goals Differential (xGD) chart.
Want to know whether your team should theoretically be higher or lower in the rankings, according to Opta data?
Read on to get the low-down on what our Expected Goals Differential table reveals…
Premier League Expected Goals Differential (xGD) table after Gameweek 10
Team | xG | xGA | xGD |
|---|---|---|---|
Arsenal | 16.16 | 7.6 | +8.56 |
Manchester City | 20.08 | 12.71 | +7.37 |
Bournemouth | 17.99 | 11.25 | +6.74 |
Brighton | 19.33 | 13.59 | +5.74 |
Nottingham Forest | 15.70 | 11.01 | +4.69 |
Liverpool | 15.81 | 13.19 | +2.62 |
Leeds Utd | 13.18 | 12.55 | +0.63 |
Fulham | 14.43 | 13.91 | +0.52 |
Tottenham | 12.41 | 12.04 | +0.37 |
Brentford | 14.63 | 14.63 | -0.13 |
Manchester Utd | 17.59 | 17.59 | -0.27 |
Everton | 13.82 | 14.2 | -0.38 |
Sunderland | 15.6 | 16.39 | -0.79 |
Chelsea | 13.99 | 14.99 | -1 |
Aston Villa | 13.8 | 18.61 | -4.81 |
Hull City | 9.48 | 14.51 | -5.03 |
Newcastle Utd | 11.53 | 16.72 | -5.19 |
Coventry City | 9.53 | 15.12 | -5.59 |
Ipswich Town | 13.5 | 19.44 | -5.94 |
Crystal Palace | 13.78 | 21.87 | -8.09 |
Arsenal’s defensive numbers stack up
Arsenal’s rock-solid rearguard needs little introduction.
The Gunners have only conceded five times across ten Premier League games this season, averaging out at just 0.5 goals against per match.
They have also kept a joint league-leading seven clean sheets, which is only matched by second-place Brighton.
Fortunately for those of an Arsenal persuasion, this resilience is reflected in the underlying numbers, too.
Mikel Arteta’s men have an xGA of only 7.6, which is key to their table-topping Expected Goals Differential figure of +8.56.
Manchester City’s xGD tally of +7.37 isn’t too shabby, though, despite their recent run of three consecutive defeats.
With a sky-high xG of 20.08, expected the Citizens to return to winning ways sooner rather than later.

Bournemouth and Brighton’s form is sustainable
Bournemouth and Brighton are famously two of the Premier League’s model clubs – and both are in the midst of impressive runs of form at present.
The Cherries have put a slow start to the season behind them by winning four matches in a row and climbing up to seventh in the table.
And Fabian Hürzeler’s outfit are enjoying an even stronger campaign so far. They sit in second after emerging victorious from six of their last seven league outings.
It will be intriguing to see if either team is still in such a lofty position come the end of the season, but the Expected Goals Differential table suggests both hot streaks are sustainable.
Marco Rose’s unit are currently third in the xGD chart with +6.74, just a place above the Seagulls on +5.74.
An exciting few months could well be in store for both South Coast sides, if they can successfully juggle continental aspirations and league performance.
All change for the relegation picture
Things are looking tight in the Premier League’s lower reaches, with bottom club Crystal Palace just six points behind top-half Aston Villa.
There’s a sense that the relegation picture is yet to truly shake out, then, and that’s reflected in the Expected Goals Differential chart.
For example, Nottingham Forest are 16th following Gameweek 10, but the data suggests they should be far higher in the table – all the way up in fifth with +4.69, in fact.
The issue facing Oliver Glasner’s team has been finishing their chances, which is also an area where Fulham have struggled.
Profligacy in front of goal is a key reason why the Cottagers are down in 15th, despite an eighth-place xGD of +0.52.

Though well short of their lofty expectations, Manchester United are unlikely to stay in the drop zone for too long.
Their 11th-place Expected Goals Differential of -0.27 is largely thanks to a commendable xG of 17.59 – the division’s fourth-best record – rather than a woeful 17.86 xGA.
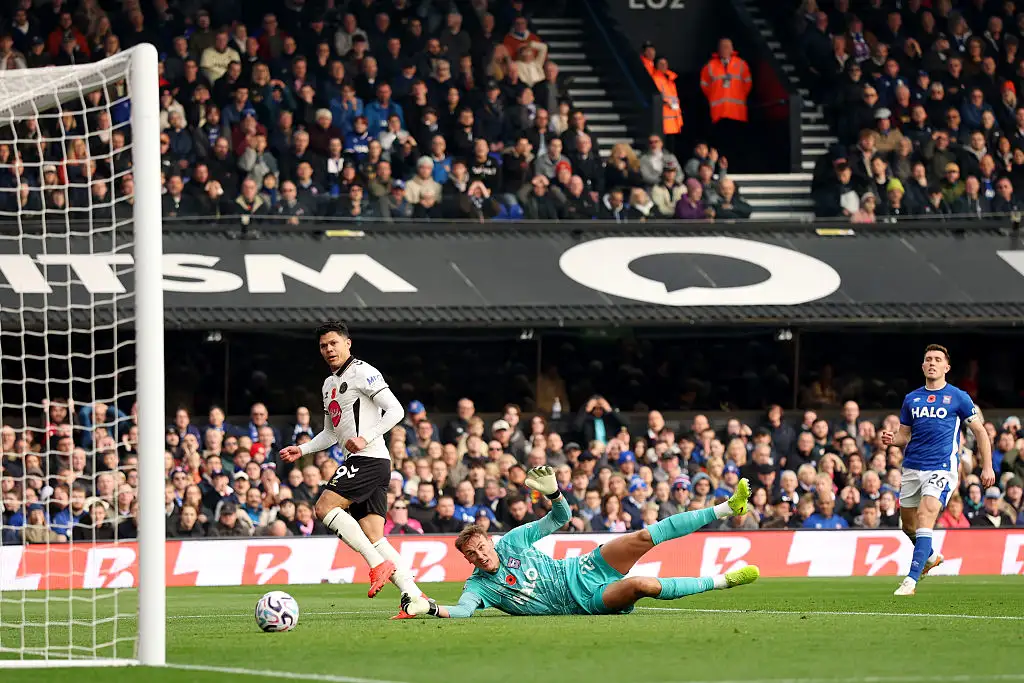
Things are looking less rosy for newly-promoted trio Hull City (-5.03), Coventry City (-5.59) and Ipswich Town (-5.94), who sit in 16th, 18th and 19th, respectively.
They are joined near the foot of the xGD table by out-of-form Newcastle United (-5.19), while Chelsea and Aston Villa's disappointing figures should raise a few eyebrows.
And look away now Crystal Palace fans: The Eagles are bottom of the pile with an xGD of -8.09, mirroring their last-place position in the current Premier League rankings.