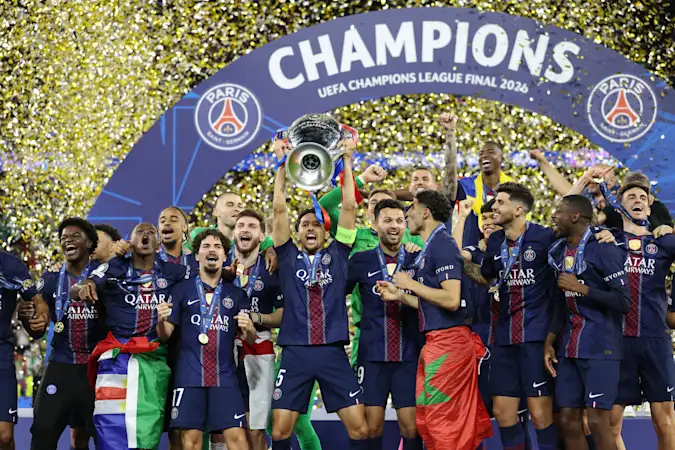
As 36 teams begin their bids to conquer Europe once again, it is PSG who enter the Champions League as the team everyone wants to beat. Luis Enrique’s side are chasing a third consecutive triumph; can any of their 35 counterparts put a stop to them?
If PSG’s rivals fail to collectively stop a treble of Champions League successes for the French giants, critics will suggest that the competition has become a closed shop, but at the same time you could argue that this has always been the case, just the name above the door changes from time to time.
We have seen dominance from Real Madrid across football’s generations; the Santiago Bernabéu outfit have lifted this trophy an unprecedented 15 times in their history, their last success back in 2024 almost approaching drought-like levels by their own standards.
Of course, the Spanish giants are not the only team to have laid claim to being the best in Europe over the years, but not many have managed to sustain that level of dominance across multiple generations.
Barcelona, Bayern Munich, AC Milan and Liverpool have all enjoyed periods where they appeared to have a stranglehold on the competition, while more recently Manchester City and Chelsea have added their names to the list of modern champions.
Which begs the question: is the Champions League really becoming less competitive, or are we simply witnessing another cycle of dominance? Rather than relying on perception of the elite passing the trophy between themselves, we can measure it instead.
Using the winners of the last 26 Champions League seasons, we have calculated a Herfindahl-Hirschman Index (HHI) or, as we will call it here, the Competitive Index — to measure how concentrated success has been across the competition.
The principle is simple: the more evenly distributed the winners are, the more competitive the Champions League becomes. If a small number of clubs repeatedly lift the trophy, the Competitive Index rises, and the competition becomes more concentrated.
Starting with the most recent ten seasons and then progressively rolling the window backwards, we can see exactly how the balance of power in European football has shifted and, crucially, whether today's Champions League is really any less competitive than the eras that came before it.
THE HALL OF FAME
To start, here is the list of winners across the last 26 seasons:
Season | Winner |
2000–01 | Bayern Munich |
2001–02 | Real Madrid |
2002–03 | Milan |
2003–04 | Porto |
2004–05 | Liverpool |
2005–06 | Barcelona |
2006–07 | Milan |
2007–08 | Manchester United |
2008–09 | Barcelona |
2009–10 | Inter Milan |
2010–11 | Barcelona |
2011–12 | Chelsea |
2012–13 | Bayern Munich |
2013–14 | Real Madrid |
2014–15 | Barcelona |
2015–16 | Real Madrid |
2016–17 | Real Madrid |
2017–18 | Real Madrid |
2018–19 | Liverpool |
2019–20 | Bayern Munich |
2020–21 | Chelsea |
2021–22 | Real Madrid |
2022–23 | Manchester City |
2023–24 | Real Madrid |
2024–25 | PSG |
2025–26 | PSG |
To measure the Competitive Index, we take any 10 years and look at how the Champions League winners were distributed and then calculate how many different clubs have been able to win the trophy, and how often each one has done so.
Take the last 10 seasons as an example. Across those ten Champions League finals, there have been six different winners: Real Madrid have won four times, PSG twice, while Bayern Munich, Liverpool, Manchester City and Chelsea have each won once.
To turn this into our Competitive Index, we first convert each club’s wins into a percentage of the 10 available trophies.
Real Madrid’s four victories account for 40% of the trophies, PSG’s two account for 20%, while Bayern Munich, Liverpool, Manchester City and Chelsea each account for 10%.
We then square each of those percentages and add them together:
(40% × 40%) + (20% × 20%) + (10% × 10%) + (10% × 10%) + (10% × 10%) + (10% × 10%) = 0.24
That gives us a Competitive Index of 0.24.
The important thing is what the number represents: the higher the score, the more concentrated the competition has been among a small number of winners. The lower the score, the more evenly the trophies have been shared.
The theoretical range runs from 0.10, the equivalent of 10 different teams winning one trophy each, to 1.00, where the same team wins all 10 trophies.
THE NUMBERS GAME
But how does that compare with previous 10-year periods?
10-Season Window | Competitive Index (HHI) | Unique Winners | Dominant Club (Titles) | Era Parity Level |
2000–01 to 2009–10 | 0.14 | 8 | Milan (2) | Peak Parity / Most Competitive |
2001–02 to 2010–11 | 0.18 | 7 | Barcelona (3) | High Parity |
2002–03 to 2011–12 | 0.18 | 7 | Barcelona (3) | High Parity |
2003–04 to 2012–13 | 0.16 | 8 | Barcelona (3) | High Parity |
2004–05 to 2013–14 | 0.16 | 8 | Barcelona (3) | High Parity |
2005–06 to 2014–15 | 0.22 | 7 | Barcelona (4) | Moderate Concentration |
2006–07 to 2015–16 | 0.18 | 7 | Barcelona (3) | High Parity |
2007–08 to 2016–17 | 0.22 | 6 | Barcelona (3) | Moderate Concentration |
2008–09 to 2017–18 | 0.28 | 5 | Real Madrid (4) | High Concentration |
2009–10 to 2018–19 | 0.24 | 6 | Real Madrid (4) | Moderate Concentration |
2010–11 to 2019–20 | 0.26 | 5 | Real Madrid (4) | High Concentration |
2011–12 to 2020–21 | 0.26 | 5 | Real Madrid (4) | High Concentration |
2012–13 to 2021–22 | 0.32 | 5 | Real Madrid (5) | Peak Concentration / Least Competitive |
2013–14 to 2022–23 | 0.30 | 6 | Real Madrid (5) | High Concentration |
2014–15 to 2023–24 | 0.30 | 6 | Real Madrid (5) | High Concentration |
2015–16 to 2024–25 | 0.30 | 6 | Real Madrid (5) | High Concentration |
2016–17 to 2025–26 | 0.24 | 6 | Real Madrid (4) | Moderate Concentration |
At first glance, the story is pretty clear. The Champions League was at its most competitive in our earliest 10-year window, from 2000–01 to 2009–10, when eight different clubs shared the ten available trophies and the Competitive Index stood at just 0.14.
From there, the competition gradually became more concentrated. The turning point came during the 2010s, as Real Madrid began to dominate the latter part of the decade. Across the 2012–13 to 2021–22 window, just five different clubs had lifted the Champions League trophy, with Real Madrid responsible for five of those ten victories.
That produced a Competitive Index of 0.32 — our highest score and therefore the least competitive period in the 26-season sample. Since then, however, the trend has started to move in the opposite direction.
Our latest 10-season window, covering 2016–17 to 2025–26, produces a Competitive Index of 0.24. Real Madrid remain the dominant club within the period, but their share has fallen from five titles to four as Chelsea, Manchester City and PSG have all added themselves to the list of winners.
The Champions League, therefore, is not currently at its least competitive point. In fact, the data suggests that concentration has begun to ease – whether this is also due to the change of format in the past couple of years is something else to consider.
But there is an interesting question hiding within those numbers: is the recent improvement enough to say that the Champions League is genuinely becoming more competitive, or are we simply at the beginning of another cycle of dominance? This next edition may have some of the answers. Especially if PSG complete a tournament threepeat.